Читать дальше......Just another nice article on how not to mess with PhD completion. Nice to read it when everything is already done :)
— Viacheslav Shalisko (@VShalisko) 4 de abril de 2019
A PhD Student’s Race Against Time – How To Win/Graduate Fasterhttps://t.co/mrKPWwyfTl
Apr 3, 2019
Читать дальше......Thesis presentation today. Getting PhD. pic.twitter.com/BLGY2i1chu
— Viacheslav Shalisko (@VShalisko) 3 de abril de 2019
Читать дальше......This is exactly how my Thesis emerged! Cool chart.
— Viacheslav Shalisko (@VShalisko) 4 de abril de 2019
PHD Comics: PhD Years-to-Thesis Chapter Conversion Chart https://t.co/PRdscR3OJo vía @phdcomics
Feb 20, 2019
В связи с упразднением G+ сюда переехали заметки первоначально опубликованные в той системе. Во многих случаях это может приводить к ошибкам форматирования ленты, но времени на исправление возникших проблем у меня сейчас нет.
Читать дальше......

Feb 16, 2019
Extraordinary interview of R. McNamee on core social networking issues
Roger McNamee: ‘It’s bigger than Facebook. This is a problem with the entire industry’
@ The Guardian
So that’s when I decided I’d better figure out exactly what happened. I met Tristan Harris, a design ethicist from Google, who talked about what he called “brain hacking”, a term that he invented to describe the persuasive technologies used by internet platforms that enable them to develop habits in the minds of the people who use the products. Those habits evolve into addictions, and that situation makes [users] vulnerable to manipulation.
They were very much in the business of manipulating attention in order to get you to spend more time on [their services]. And that is a very dangerous business model for society. It’s bad for the mental health of the people who use it. It’s terrible for democracy. It’s completely destroyed any sense of privacy, and it’s undermined entrepreneurship in the United States [...]Read the full article Читать дальше......
Sep 5, 2018
Sep 2, 2018
Ciliophora Vaginicola aff. attenuata en nuestra pecera
Ciliophora Vaginicola aff. attenuata en nuestra pecera
https://www.youtube.com/watch?v=ioVG5ghIBv4&feature=share Читать дальше......
https://www.youtube.com/watch?v=ioVG5ghIBv4&feature=share Читать дальше......
Aug 28, 2018
How to downscale temperature raster with higher resolution Digial Elevation Model
Transform low resolution to high, with statistical predictor.
From this:
 To this:

Useful example with code in Rmd. Full script @GitHub
Load requiered libraries.
From this:


Useful example with code in Rmd. Full script @GitHub
Load requiered libraries.
```{r setup, include=FALSE}
library(sp)
library(raster)
```
Some magic happens here - Check the full code @GitHub.
Store the result in GeoTIFF.
```{r save-downscaled-raster}
    # write GeoTIFF with float 32 and LZW compression
    writeRaster(corrected_raster, filename=paste(basepath,
    '/' ,basename ,'.tif',sep=''), format="GTiff", overwrite=TRUE,
    datatype = 'FLT4S', options=c("COMPRESS=LZW"))
```
Читать дальше......
Aug 6, 2018
BBC environment correspondence:
BBC environment correspondence:
Climate change: 'Hothouse Earth' risks even if CO₂ emissions slashed - http://www.bbc.co.uk/news/science-environment-45084144
http://www.bbc.co.uk/news/science-environment-45084144 Читать дальше......
Climate change: 'Hothouse Earth' risks even if CO₂ emissions slashed - http://www.bbc.co.uk/news/science-environment-45084144
http://www.bbc.co.uk/news/science-environment-45084144 Читать дальше......
Jul 26, 2018
Jul 4, 2018
On vulnerability of human psichology:
On vulnerability of human psichology:
Social media apps are 'deliberately' addictive to users - http://www.bbc.co.uk/news/technology-44640959
http://www.bbc.co.uk/news/technology-44640959 Читать дальше......
Social media apps are 'deliberately' addictive to users - http://www.bbc.co.uk/news/technology-44640959
http://www.bbc.co.uk/news/technology-44640959 Читать дальше......
Jun 28, 2018
Mi parte son últimos 35 segundos [2:48 - 3:23]
Mi parte son últimos 35 segundos [2:48 - 3:23]
https://www.youtube.com/watch?v=zc5dWeF9tfY
https://www.youtube.com/watch?v=zc5dWeF9tfY Читать дальше......
https://www.youtube.com/watch?v=zc5dWeF9tfY
https://www.youtube.com/watch?v=zc5dWeF9tfY Читать дальше......
Apr 15, 2018
Proyectos en Naturalista.com
Son 2 nuevos proyectos para organizar las observaciones útiles en didáctica (curso 'Plantas con semilla' y otros).
- Flora del Sendero Arroyo del Carbón, Bosque la Primavera
- Practica de campo para curso de Espermatofitas
Apr 3, 2018
Северное сияние
Сегодня я прослушал на Эхо Москвы передачу, в которой обсуждались жизненные обстоятельства россиян и заирагивалась тема их личного выбора, который на самом деле до сих пор существует. Я с этим совершенно согласен и тоже считаю что сейчас выбор может быть только личным, и многеюие его сделали, и я его сделал. Меня эта тема беспокоит, так как всё же существует некоторая этическая напряженность, связанная с этим выбором и всё же хочется знать мнение других людей об этом. Так вот, зная что жизненные обстоятельства россиян в настоящее время, и в ближайшем будущем являются неизменной данностью, являниями подобными вечной мерзлоте или северному сиянию, такой личный выбор делать проще.
На Эхо Москвы было ещё несколько ярких слов про северное сияние, но я их не стану повторять.
Читать дальше......
На Эхо Москвы было ещё несколько ярких слов про северное сияние, но я их не стану повторять.
Mar 10, 2018
Visualization of paired Mann-Whitney U test for several variables in R
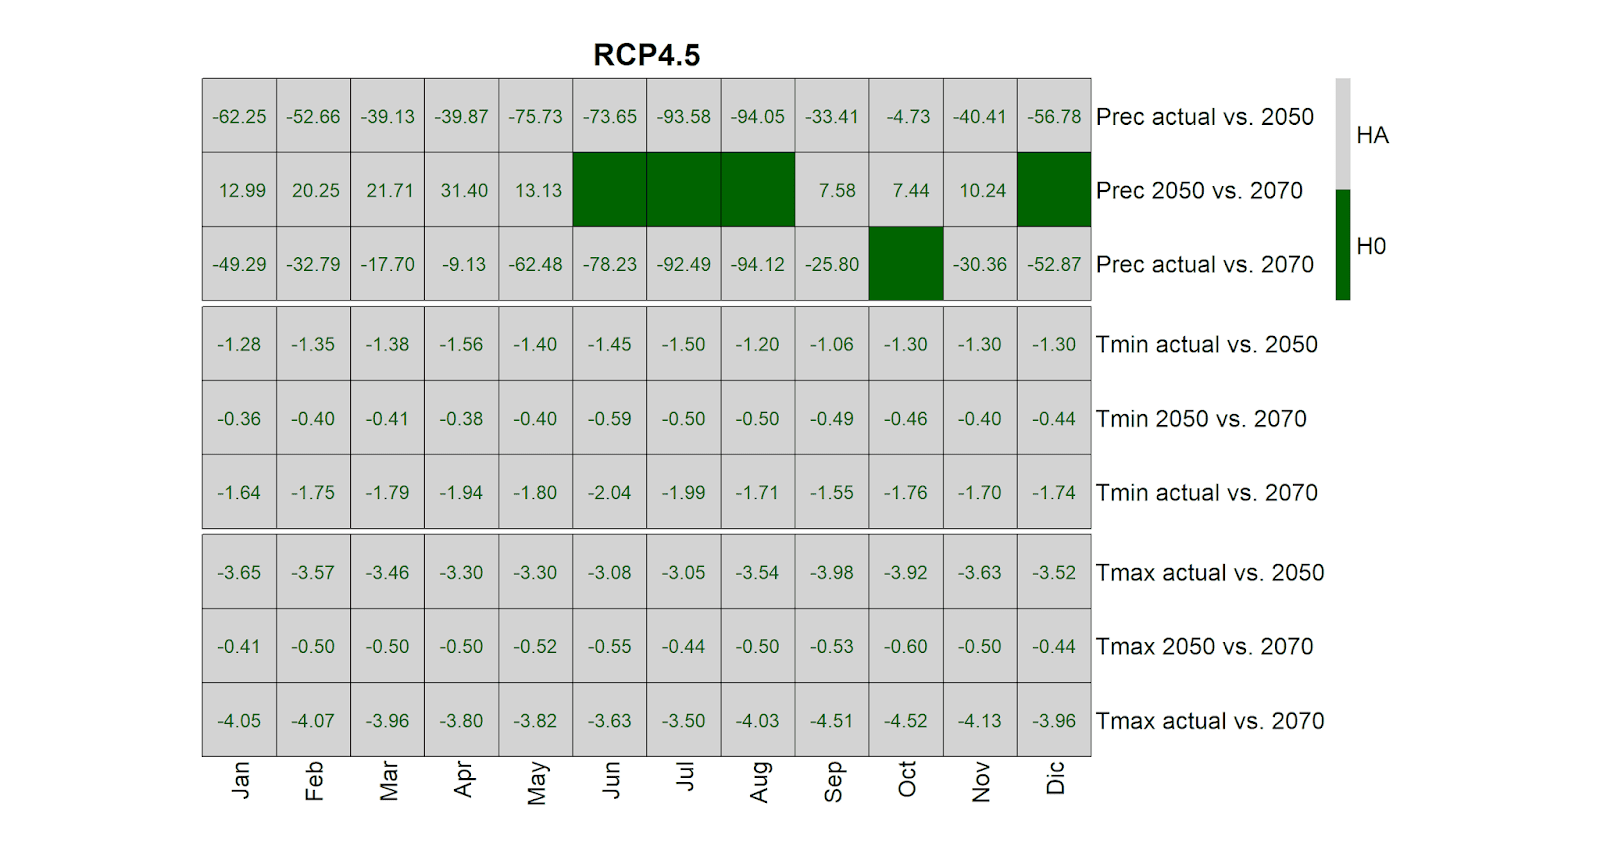
As a part of our recent research, we made several visualizations of variable comparizon. The boxplot gives good visual results, but the paired Mann-Whitney U test is required to access the statistical significance of differences. In order to visualize results of this test we us the following graphics:
 The package pheatmap ver. 1.0.8 was found to be rather useful and flexible for visualization of such paired test data. Usually this package is used to make heatmaps with clusterization, but our choice is to adopt it to deal with binary data. Here is some code fragments used to perform the test and visualize it results.
The test itself is part of the following function:
The test itself is part of the following function:
compareMWT = function(x, y, test_title, alternative='two.sided') {
  wilcoxTest_result <- wilcox.test(x,y,
                        alternative=alternative,conf.int=TRUE)
  cat('Mann-Whitney test results for',test_title,"\n",sep=' ')
  if (wilcoxTest_result$p.value < 0.05) {
      cat('The H0 is rejected as p < 0.05,
              the HA accepted (medians unequal)',"\n")
  } else {
      cat('The HA is rejected as p >= 0.05,
              the H0 accepted (medians equal)',"\n")
  }
  print(wilcoxTest_result)
}
Our data includes Magn_prec00, Magn_prec50, Magn_prec70 and similar variables as data to be compared. The month_list is month names vector. Test is called in cycle (12 months) for the desired combinations (pairs) of variables. Test results are stored in two matrices: one for binary output (the H0 is coded as 0 and the HA as 1), and another matrix is to store the estimation of centrality shift.
# true-false H0 vs. HA matrices
MWU_prec_RCP45_matrix <- matrix(nrow = 12, ncol = 3)

# location shift estimation matrices
MWU_prec_RCP45_matrix_s <- matrix(nrow = 12, ncol = 3)

for (i in 1:12) {
  my_test1 <- compareMWT(Magn_prec00[,i],Magn_prec50[,i],
    paste(month_list[i],'precipitation: actual vs. RCP4.5 2050'))
  my_test2 <- compareMWT(Magn_prec50[,i],Magn_prec70[,i],
    paste(month_list[i],'precipitation: RCP4.5 2050 vs. RCP4.5 2070'))
  my_test3 <- compareMWT(Magn_prec00[,i],Magn_prec70[,i],
    paste(month_list[i],'precipitation: actual vs. RCP4.5 2070'))

  if (my_test1$p.value < 0.05) {
    MWU_prec_RCP45_matrix[i,1] <- 1
    MWU_prec_RCP45_matrix_s[i,1] <- my_test1$estimate
  } else {
    MWU_prec_RCP45_matrix[i,1] <- 0
  }
  if (my_test2$p.value < 0.05) {
    MWU_prec_RCP45_matrix[i,2] <- 1
    MWU_prec_RCP45_matrix_s[i,2] <- my_test2$estimate
  } else {
    MWU_prec_RCP45_matrix[i,2] <- 0
  }
  if (my_test3$p.value < 0.05) {
    MWU_prec_RCP45_matrix[i,3] <- 1
    MWU_prec_RCP45_matrix_s[i,3] <- my_test3$estimate
  } else {
    MWU_prec_RCP45_matrix[i,3] <- 0
  }
}
The visualization in pheatmap is nice, but the labels of the x-axis are oriented 270° by default, to override this strange feature we use custom function, identical to draw_columns internal function of pheatmap, except the rotation rot = 90 and ajustment hjust = 1. The override works within session by assignInNamespace.
library(pheatmap)

draw_colnames_90 <- function(coln, gaps, ...) {
    coord = pheatmap:::find_coordinates(length(coln), gaps)
    x = coord$coord - 0.5 * coord$size
    res = grid:::textGrob(coln, x = x,
          y = grid:::unit(1, "npc") - grid:::unit(3, "bigpts"),
          vjust = 0.5, hjust = 1, rot = 90, gp = grid:::gpar(...))
    return(res)
}

assignInNamespace(x="draw_colnames",
          value="draw_colnames_90", ns=asNamespace("pheatmap"))
The visualization itself inslude dark green cells for cases where the H0 is acepted (no significant difference in medians), and light gray cells for cases of alternative hypothesis HA. The numbers within cells indicate the estimated median shift.
MWU_prec_RCP45_matrix_s <- format(MWU_prec_RCP45_matrix_s,
                                        digits=2, nsmall=2)
MWU_tmin_RCP45_matrix_s <- format(MWU_tmin_RCP45_matrix_s,
                                        digits=2, nsmall=2)
MWU_tmax_RCP45_matrix_s <- format(MWU_tmax_RCP45_matrix_s,
                                        digits=2, nsmall=2)

pheatmap(rbind(t(MWU_prec_RCP45_matrix),
               t(MWU_tmin_RCP45_matrix),
               t(MWU_tmax_RCP45_matrix)),
         display_numbers = rbind(
               t(MWU_prec_RCP45_matrix_s),
               t(MWU_tmin_RCP45_matrix_s),
               t(MWU_tmax_RCP45_matrix_s)),
         fontsize_number = 13,
         number_color = 'darkgreen',
         color = c('darkgreen','lightgray'),
         border_color = 'black',
         cellwidth = 50, cellheight = 50,
         symm = FALSE,
         cluster_rows = FALSE,
         cluster_cols = FALSE,
         gaps_row = c(3,6),
         legend_breaks = c(0,0.25,0.5,0.75,1),
         legend_labels = c('','H0','','HA',''),
         labels_col = month_list,
         labels_row = c('Prec actual vs. 2050',
          'Prec 2050 vs. 2070','Prec actual vs. 2070',
                        'Tmin actual vs. 2050',
          'Tmin 2050 vs. 2070','Tmin actual vs. 2070',
                        'Tmax actual vs. 2050',
          'Tmax 2050 vs. 2070','Tmax actual vs. 2070'),
         main = 'RCP4.5', fontsize = 16)
.
Читать дальше......
Subscribe to:
Posts (Atom)


